
Bitcoin’s Latest Surge: A Look at Market Trends
Bitcoin’s price has reached levels not seen since July, driven by positive inflows and optimism surrounding a potential bullish breakout. Despite ETF inflows, the actual demand for Bitcoin has been declining since March, according to Glassnode data. Technical analysis indicates that Bitcoin is encountering resistance at various levels, with support levels identified in the event of a price decline.
Market Inflows and Predictions
Optimism is growing that the world’s largest cryptocurrency is preparing for a bullish breakout. The recent surge in prices comes after a week of positive inflows, with many attributing this to the upcoming US elections. Spot Bitcoin ETF flows had a remarkable week ending on October 11, culminating in the biggest daily inflow since June. This surge in inflows has sparked hope for a continued positive trend in the market.
Source: CoinGlass, Cointelegraph
Assessing Downside Risks and Investor Sentiment
Despite the recent positive trends, there are concerns about downside risks, such as profit-taking and waning demand. Glassnode data suggests that actual demand has been decreasing since March, with investor attention and new demand inflows staying relatively muted. Long-term investors have remained inactive in the market, indicating a lack of demand around current price levels.
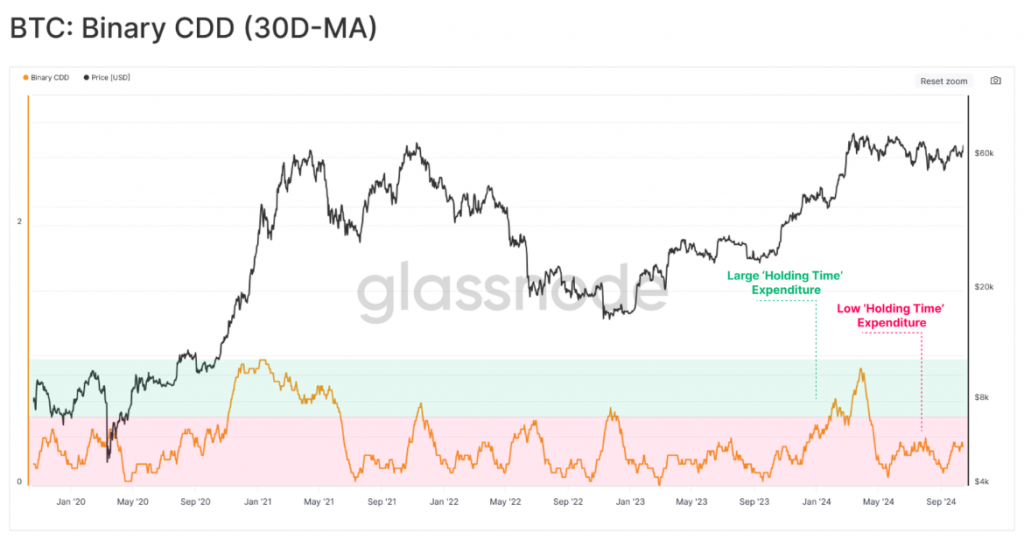
Source: Glassnode
The lack of demand at current price levels should be a concern for Bitcoin bulls, as overcoming these levels has proven to be challenging in the past.
Technical Analysis and Chart Trends
In technical analysis, Bitcoin is currently trading slightly up on the day, facing various hurdles in its upward trajectory. Resistance levels lie ahead at key price points, making the path to a breakout uncertain. Additionally, potential support levels are identified in the event of a price decline, with indicators highlighting critical levels for Bitcoin’s price movement.
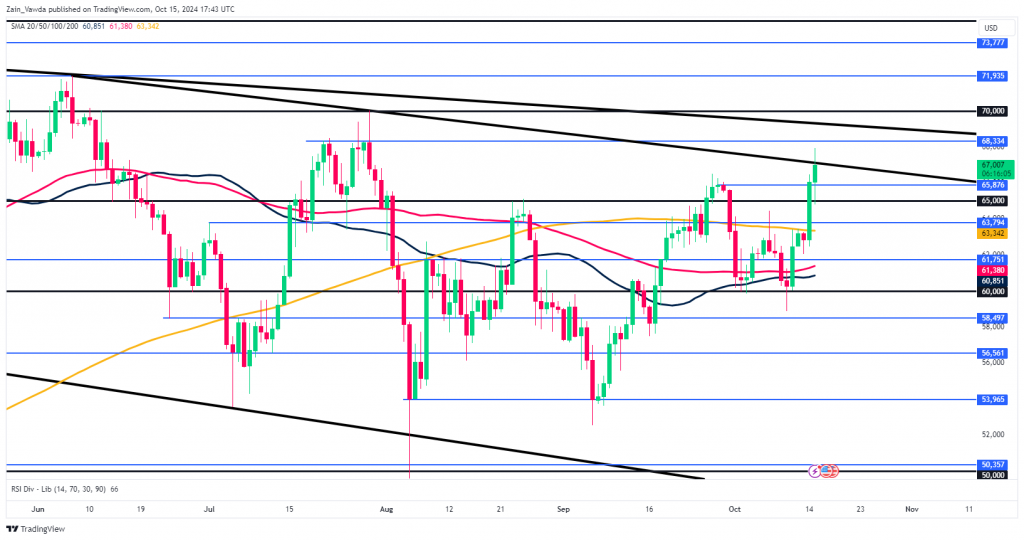
Source: TradingView.com
Source : www.marketpulse.com