![Nasdaq Elliott Wave technical analysis [Video]](https://fessierfinance.fr/wp-content/uploads/2024/09/Analyse-technique-NASDAQ-Tendance-haussiere-confirmee.jpg)
NASDAQ Elliott Wave Analysis Trading Lounge Day Chart
Technical Analysis of the NASDAQ Elliott Wave
Our analysis indicates that the NASDAQ market is currently in a bullish trend with an impulsive wave structure, specifically Navy Blue Wave 3. This phase represents a strong and sustained upward movement, with the market now positioned in Gray Wave 3, showing momentum in this advanced stage of the trend.
Wave Structure and Position
Having completed Navy Blue Wave 2, the market is progressing through Navy Blue Wave 3, which is typically associated with continued bullish momentum. Once this wave is complete, the next phase will be Navy Blue Wave 4, potentially introducing a temporary correction before the uptrend resumes.
Key Details
The completion of Navy Blue Wave 2 and the progression into Navy Blue Wave 3 suggest that the upward momentum will persist. It is important to note that if the market drops below 18,295.9, the current wave count would be invalidated, requiring a reassessment of the market’s structure.
Summary: The NASDAQ is expected to continue its strong upward trend with Navy Blue Wave 3 driving the market higher. As long as the market remains above 18,295.9, further gains can be anticipated. Analysts should be prepared for potential corrections as the market transitions into Navy Blue Wave 4.
NASDAQ Elliott Wave Analysis Trading Lounge Weekly Chart
Technical Analysis of the NASDAQ Elliott Wave
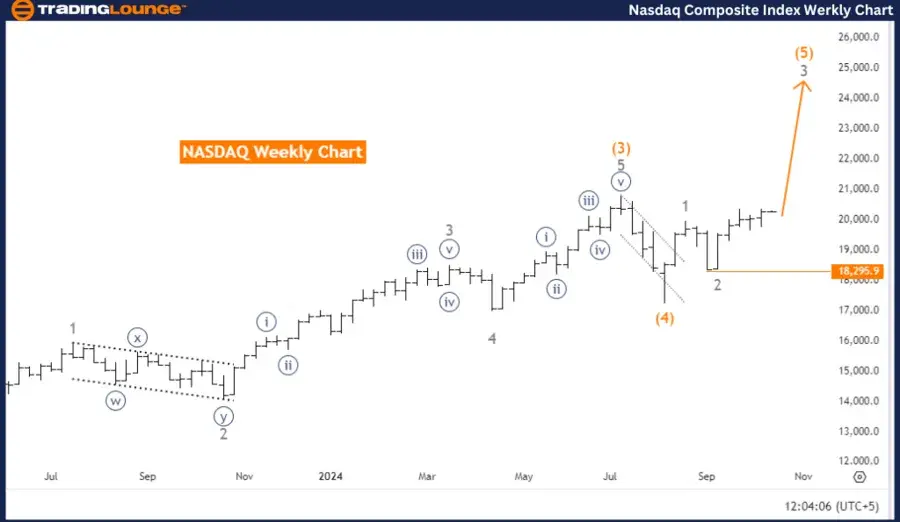
Our analysis of the NASDAQ on the weekly chart confirms a strong upward trend with an impulsive wave structure unfolding in Gray Wave 3. The market’s position within the wave cycle is in Orange Wave 5, signaling advancement towards the later stages of the impulse sequence.
Wave Structure and Position
Following the completion of Gray Wave 2, the market is now progressing through Gray Wave 3, demonstrating robust bullish momentum. This phase indicates a probable continuation of the upward trend, with Gray Wave 4 expected to introduce a corrective pullback before the overall bullish trajectory resumes.
Key Details
Gray Wave 3 is currently unfolding, suggesting further upward movement in the market. After the completion of Gray Wave 3, Gray Wave 4 is likely to bring a corrective pullback before the broader uptrend resumes. It is essential to monitor the market closely for any potential invalidation of the current wave count if prices fall below 18,295.9.
Summary: The NASDAQ is in a strong upward trend with Gray Wave 3 propelling the market higher. Traders should expect further gains while being prepared for a potential correction when transitioning into Gray Wave 4. As long as the market remains above 18,295.9, the bullish outlook remains intact.
Technical Analyst: Malik Awais
NASDAQ Elliott Wave Technical Analysis [Video]
Source : www.fxstreet.com